


Strategically, the OFCCP has largely shared their two-part game plan:
- Internal Pay Equity: The OFCCP will measure pay equity within a company to ensure that there is internal equity; in other words, that employees within the same EEO Category are paid equitably.
- External Pay Equity: The OFCCP will measure pay equity between companies; specifically, they will compare a company’s EEO-1 Pay Data against others in the relevant business sector.
Measuring Internal Pay Equity
To measure internal pay equity, the OFCCP is clear1:- Mann-Whitney U test will be used to measure pay equity for gender and 2-group comparisons.
- Kruskal-Wallis test will be used to measure pay equity for race where more than two groups are compared.
In concept, these analyses can determine whether there is a bias in the distribution of men and women along the 12 pay bands (ranging from lowest 1 = less than $19,239, to highest 12 = $208,000 or greater). For example, if women tend to dominate lower-paying salary bands while men are in the higher-paying salary bands, then women are being paid less than men. The Mann-Whitney U and Kruskal-Wallis can determine if there are differences in the distribution of gender or race across the 12 bands, respectively.
To help make sense of all of this, here is a sample report by gender for EEO Category professional:
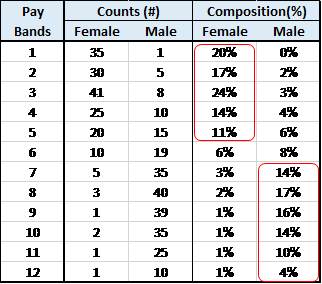
Per the EEOC reporting requirements, the counts of male and female employees were reported by the pay bands. The statistical analyses will examine the actual counts. In concept, the analyses are looking for patterns in the distribution of males and females across the pay bands. In this example, note that females dominate the lower 1-5 pay bands, while men dominate the higher 7-12 pay bands. The statistical methods will identify this group difference and estimate its statistical significance.
Measuring External Pay Equity
The OFCCP is less clear on their strategy to measure external pay equity with the EEO-1 pay data. This is understandable as Title VII is primarily concerned with internal pay equity, and the law is less concerned with compensation philosophy where a company may choose to pay below-labor market standards as long as everyone is impacted equally.Contractors need to be aware that there is an analytical approach that could assist the OFCCP and EEOC to identify employers with potential pay equity problems. Consider the following analysis example of EEO Category 1.1:
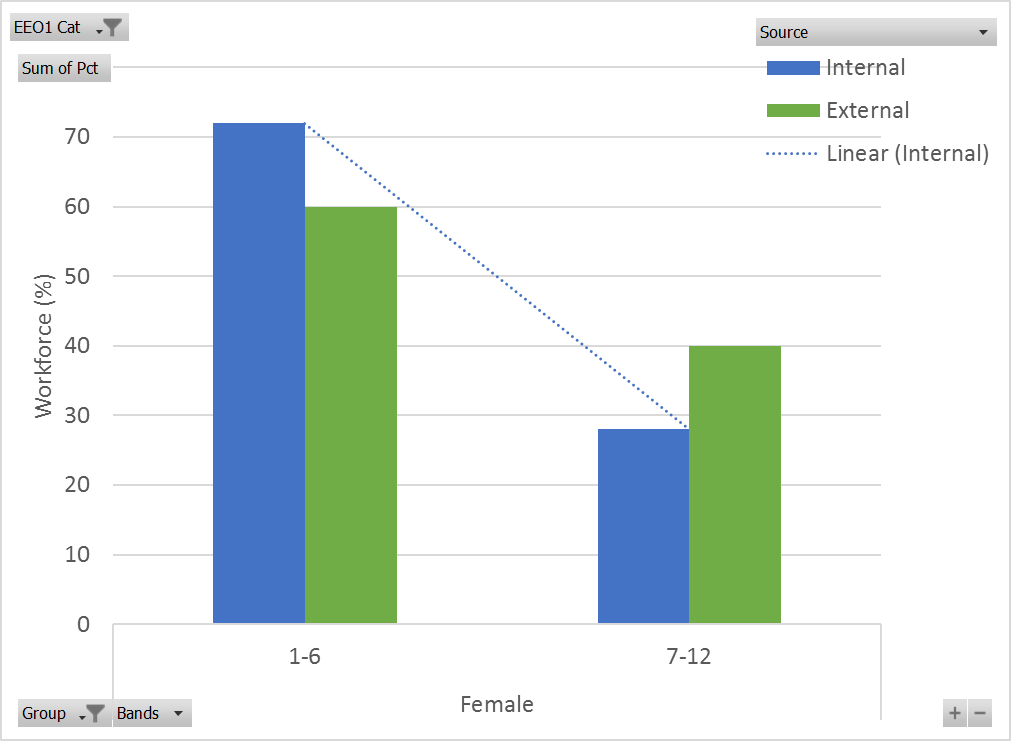
To simplify this analytical method, pay bands 1-6 are collapsed into “1-6” and pay bands 7-12 are collapsed into “7-12”. Note the interesting pattern when comparing internal composition (%) against external composition (%):
- Females have higher internal representation in pay bands 1-6 (72%) than external data (60%).
- Females have lower internal representation in pay bands 7-12 (28%) than external data (40%).
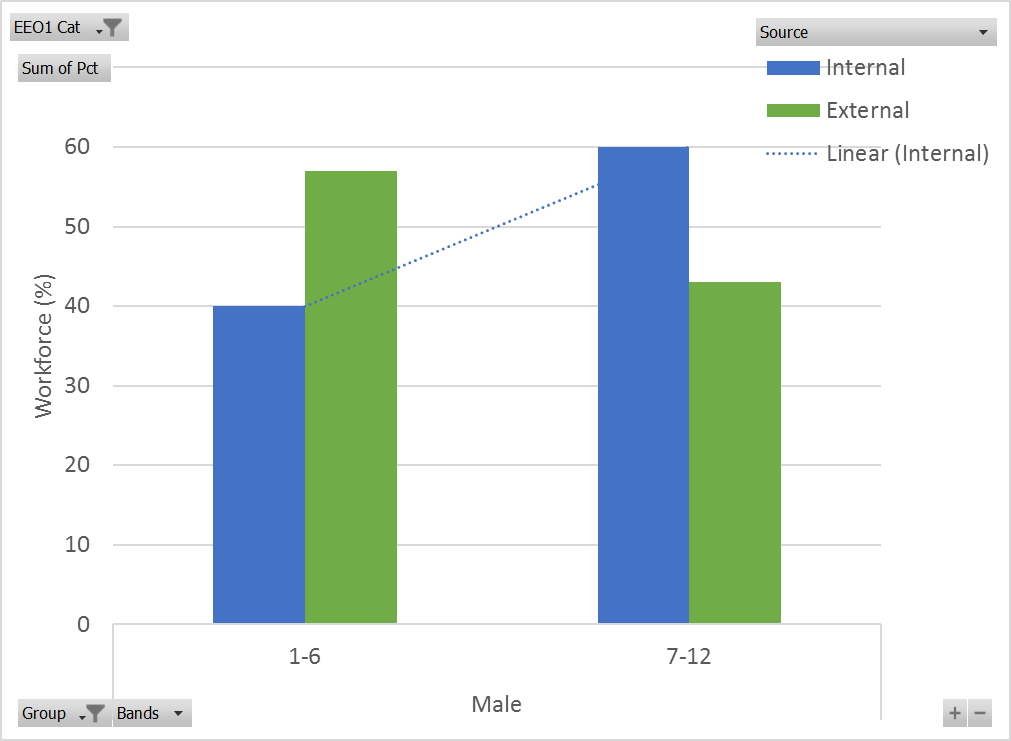
- Males have lower internal representation in pay bands 1-6 (40%) than external data (57%).
- Males have higher internal representation in pay bands 7-12 (60%) than external data (43%).
- Women tend to hold the lower pay band positions (1-6) while men hold the higher pay band positions (7-12). This pattern maps onto the external pay data and, therefore, is not too concerning.
- Women have higher representation in lower pay bands than external data, while the opposite is true for men, who have lower representation in the lower pay bands than external data. This pattern is problematic.
- Women have lower representation in higher pay bands than external data, while the opposite is true for men, who have higher representation in higher pay bands than external data. This pattern is problematic.
Conclusions
One of the most compelling arguments against EEO-1 Component 2 reporting has been the concern that no meaningful conclusions can be drawn from analysis of broad EEO categories; the results will primarily be a mix of false positives and false negatives. Analyses that do not make proper apples-to-apples comparisons among similarly situated employees will most likely suffer this very likely consequence. Having said that, it is important to keep in mind that the OFCCP and EEOC will most likely use the EEO-1 pay data to flag employers who may have pay equity problems rather than to establish prima-facia claims of pay disparity. The methods discussed in this paper serve this purpose well.By measuring internal and external pay equity with a lens for patterns, the OFCCP and EEOC can more efficiently identify employers who may be considered for more thorough and complex Title VII-oriented pay equity investigations. Employers should not dismiss the very likely danger that lurks once their EEO-1 Component 2 pay data is reported.
1. Federal Register, Vol 80 (20), p. 5118, footnote 47